3DDB Viewer Version 0.5.2 Manual
Introduction
This document describes how to use a Web-based user interface (hereinafter referred to as “3DDB Viewer”) for displaying model data registered in the 3DDB database operated and managed by the Geographical Information Science Research Team, Artificial Intelligence Research Center, Information and Human Engineering Field, National Institute of Advanced Industrial Science and Technology (AIST).
Operating Environment
We have confirmed that 3DDB Viewer works in the following environments.
The environment at the bottom is the minimum operating environment.
Hardware/OS/Web Browser |
|---|
DELL Alienware (CPU: Intel(R) Core(TM) i9-12900HK MEM: 64GB GPU: GeForce RTX3080Ti)
Windows 11 Professional
Chrome version 107.0.5304.87, Firefox version 106.0.2 (64bit)
|
ASUS ROG (CPU: Intel(R) Core(TM) i9-11900H MEM: 32 GPU: GeForce RTX3080 Laptop GPU)
Windows 10 Professional
Chrome version 107.0.5304.87, Firefox version 106.0.2 (64bit)
|
MacBook Pro 13-inch, M1, 2020 (CPU: Apple M1 MEM: 16GB)
macOS Monterey version 12.6.1
Chrome version 107.0.5304.87, Firefox version 106.0.2 (64bit)
|
DELL Alienware (CPU: Intel(R) Core(TM) i9-8950HK MEM: 32GB GPU: GeForce GTX1080 with Max-Q)
Windows 10 Enterprise
Chrome version 107.0.5304.87, Firefox version 106.0.2 (64bit)
|
MacBook Pro 13inch 2016 (CPU: Intel(R) Core(TM) i5 MEM: 16GB)
macOS Monterey version 12.6.1
Chrome version 107.0.5304.87, Firefox version 106.0.2 (64bit)
|
Attention
It should work in the same level of environment as above, but it is not guaranteed to work in all environments.
Basically, the operation by the environment other than the operation check is not guaranteed at all.
If the model data to be displayed is complex or if multiple model data are to be displayed and the client side machine specifications are insufficient, the 3DDB Viewer may stop operating due to the following error (rendering error).
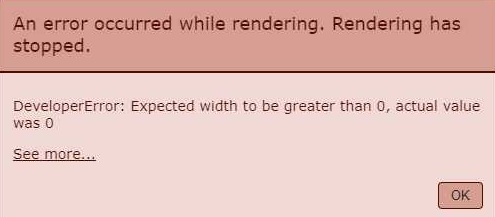
If this occurs, reload the Web browser, avoid displaying the model data in question, or reduce the number of model data to be displayed.
The same error may also occur when there is no shortage of machine specs, in which case, please take the aforementioned measures.
If the rendering error occurs when the machine spec is not insufficient, the problem may be caused by a web browser error, so it may be possible to avoid the problem by using Firefox if the problem occurs when using Chrome, or using Chrome if the problem occurs when using Firefox. If the problem occurs when using Chrome, use Firefox; if the problem occurs when using Firefox, use Chrome.
In addition, upgrading the Web browser version may resolve the error (or vice versa).
Warning
The following environments have not been tested.
Web browsers: Internet Explorer, Microsoft Edge (not the Chromium baseed), and Safari
Environments: Android OS
We have confirmed that operation in the following environments is incomplete.
Environments: iOS, iPadOS
It works, but cannot perform dialog dragging operation.
How to Use
The following sections describe how to use the 3DDB Viewer.
Basic Operation
The basic operations of 3DDB Viewer are described in the following sections.
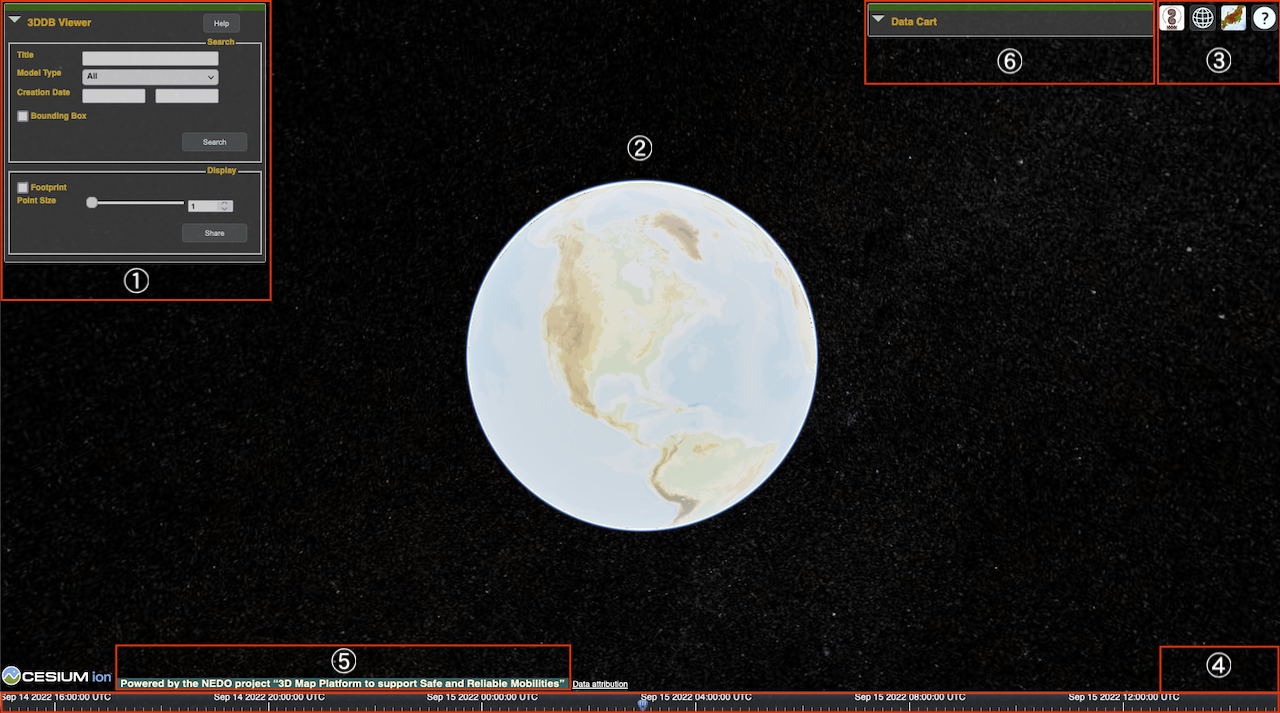
Figure 1. 3DDB Viewer (Click to enlarge)
Figure 1. shows the screen after starting the 3DDB Viewer. The 3DDB Viewer consists of the numbered areas (1) to (5) as shown in Figure 1. Each area has the following functions
(1) Model Data Search and Display Control Panel
It has functions for searching model data and displaying and downloading model data.
For specific instructions on how to use this function, please refer to “Searching, Viewing and Downloading Model Data” below.
(2) Base Layer
This panel is responsible for displaying model data. The model data selected in “(1) Model data search and display control panel” is displayed here.
The operations on the base layer are as follows.
Manipulation |
Base Layer Behavior |
|---|---|
Drag left mouse button + move mouse |
Move (Figure. 2. red arrow) |
Shift + drag left mouse button + move mouse |
translation (Figure. 2. light blue arrow) |
Rotate mouse wheel |
Zoom in/out |
Drag the mouse wheel + move the mouse
Or
Ctrl + drag left mouse button + move mouse
|
Rotate (Figure. 2. green arrow) |
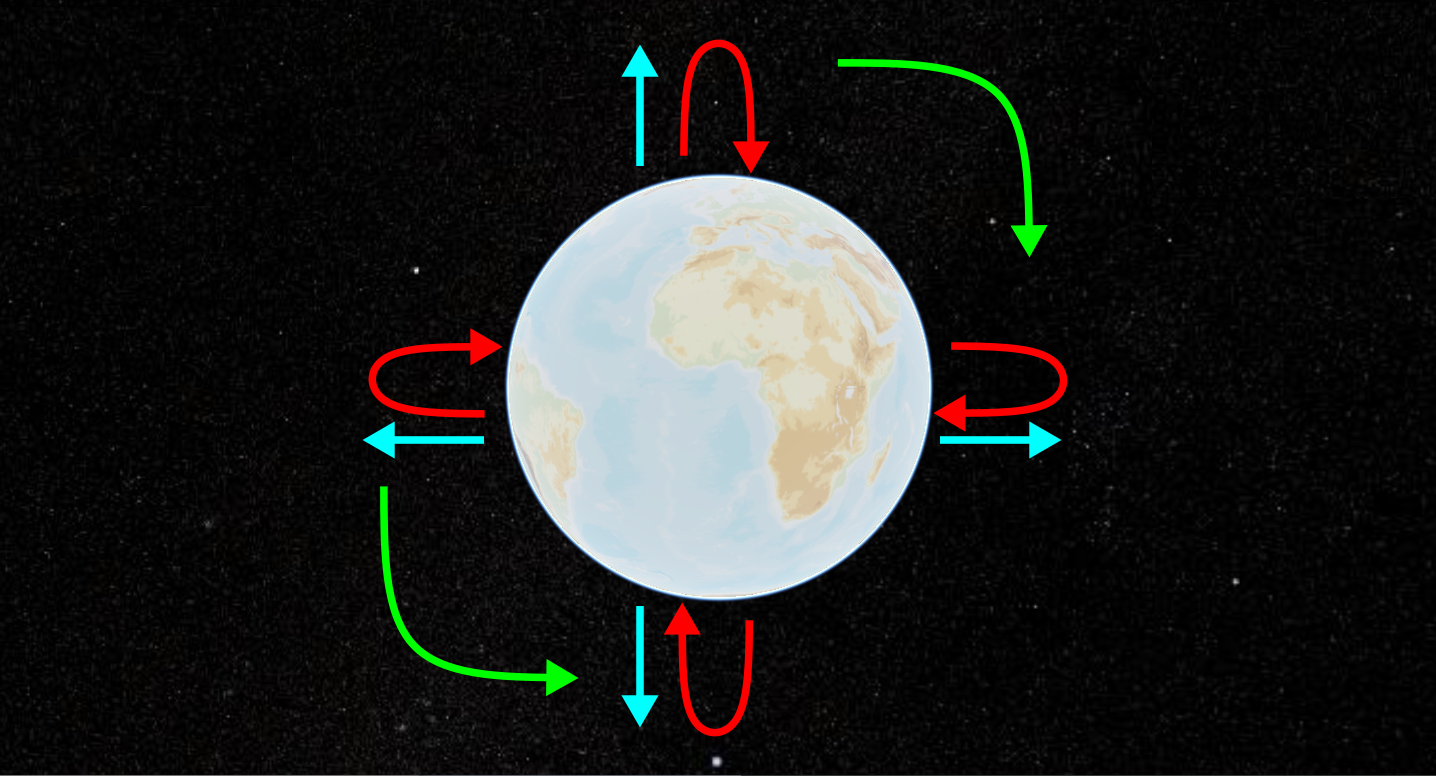
Figure 2. Base layer manipulation (Click to enlarge)
(3) Toolbox
It serves as a simple help for changing the base layer and model display mode (scene mode). For specific instructions on how to use it, see “Toolbox” below.
(4) Time bar
It is responsible for changing the time in the 3DDB Viewer.
In a structural model that is affected by ambient light, the shading of the building and other features change as the time of day changes.
You can change the time by clicking anywhere on the bar, or by dragging the knob on the bar.
The time when the 3DDB Viewer is started is noon in the time zone of the started environment.
Attention
The time bar displays the time in Coordinated Universal Time (UTC), so noon may not be noon depending on the time zone of the environment in which you run the 3DDB Viewer.
For example, if the time zone of the environment you are running in is Japan Standard Time (JST), noon (12:00) in JST will be 3:00 in the time bar, since from UTC a time difference of +9 hours.
The center of the time bar is set to be the noon of the environment in which it is launched, so if you are confused, please recognize that the center of the time bar is noon.
(5) Credit
This is a credit for 3DDB Viewer. It does not have any other functions.
(6) Model data cart
It has responsible functions related to the keeping and display of selected model data.
For specific instructions on how to use this function, please refer to “Searching, Viewing and Downloading Model Data” below.
Model data search, display and download
The following section describes how to search, display and download model data in 3DDB Viewer.
Model data search
It is necessary to select registered model data to display model data.
This section describes how to search for registered model data.
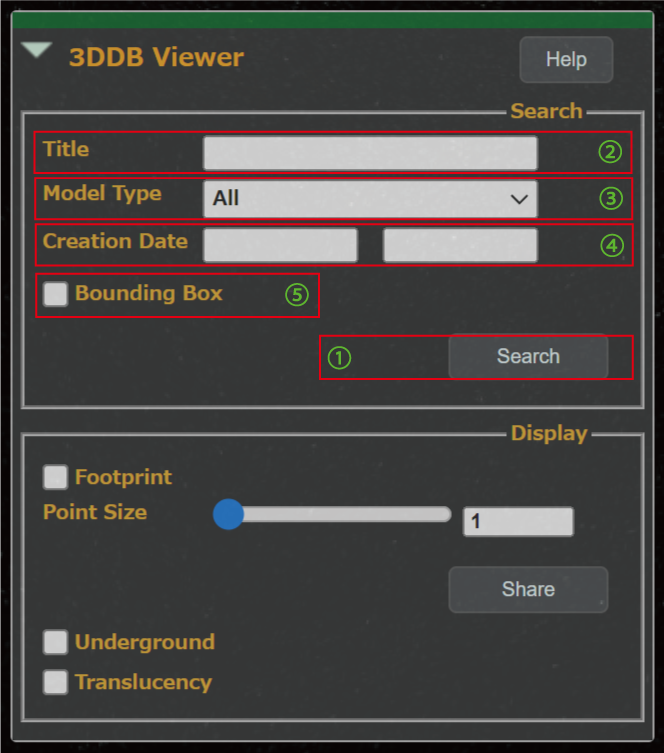
Figure 3. Model Data Search Items (Click to enlarge)
Among the items in the Model Data Search and Display Control Panel, the items related to the search and their descriptions are listed below.
Search button
Searches for model data.
If you execute a search without specifying any of the items described in the following section, the top 500 registered model data in the order of registration will be returned.
Model data registration information search field
The title and the description of model data (description) are added as search criteria.
The input is treated as a partial match.
Model data type selection
Add the type of model data as a search condition.
Descriptions for each type are listed below.
Species Name
Description
All
All types
Point Cloud
For point cloud data
Surface
For polygon data
Structure
For structures (such as stations and facilities)
CityGML
For CityGML data
Registration date search field
You can add the registration date of the model data as a search condition.
The left input field is the start date and the right input field is the end date.
If you enter only the start date, the start date will be entered after the specified date, if you enter only the end date, the end date will be entered by the specified date, and if you enter both, the specified range will be the search condition.
In addition, you can select a range of data to enter by clicking on the input field.
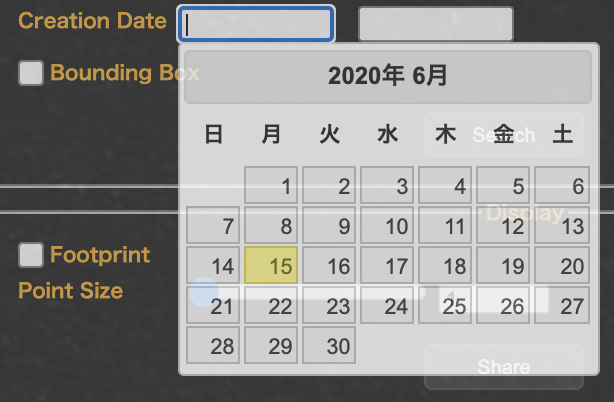
Figure 4. Selective entry by calendar
Search range specification
Add an arbitrary position/area on the base layer as a search condition.
When the checkbox is checked, the following items are expanded and a cube (bounding box) representing the search range is displayed on the base layer.
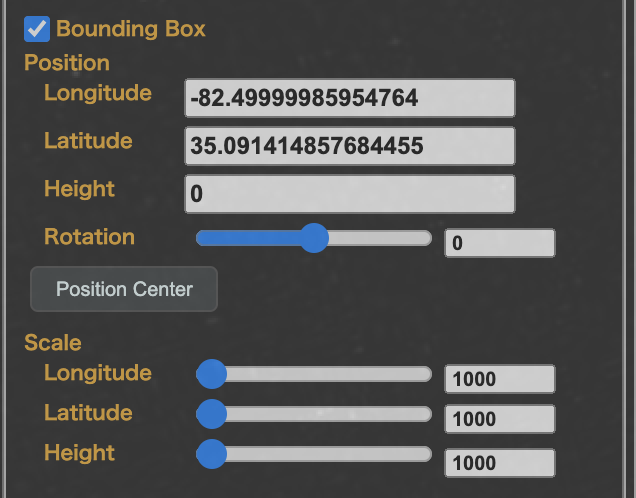
Figure 5. Search range specification
The bounding box will be displayed at the center of the base layer after starting 3DDB Viewer, or at the user-specified position after the second time.
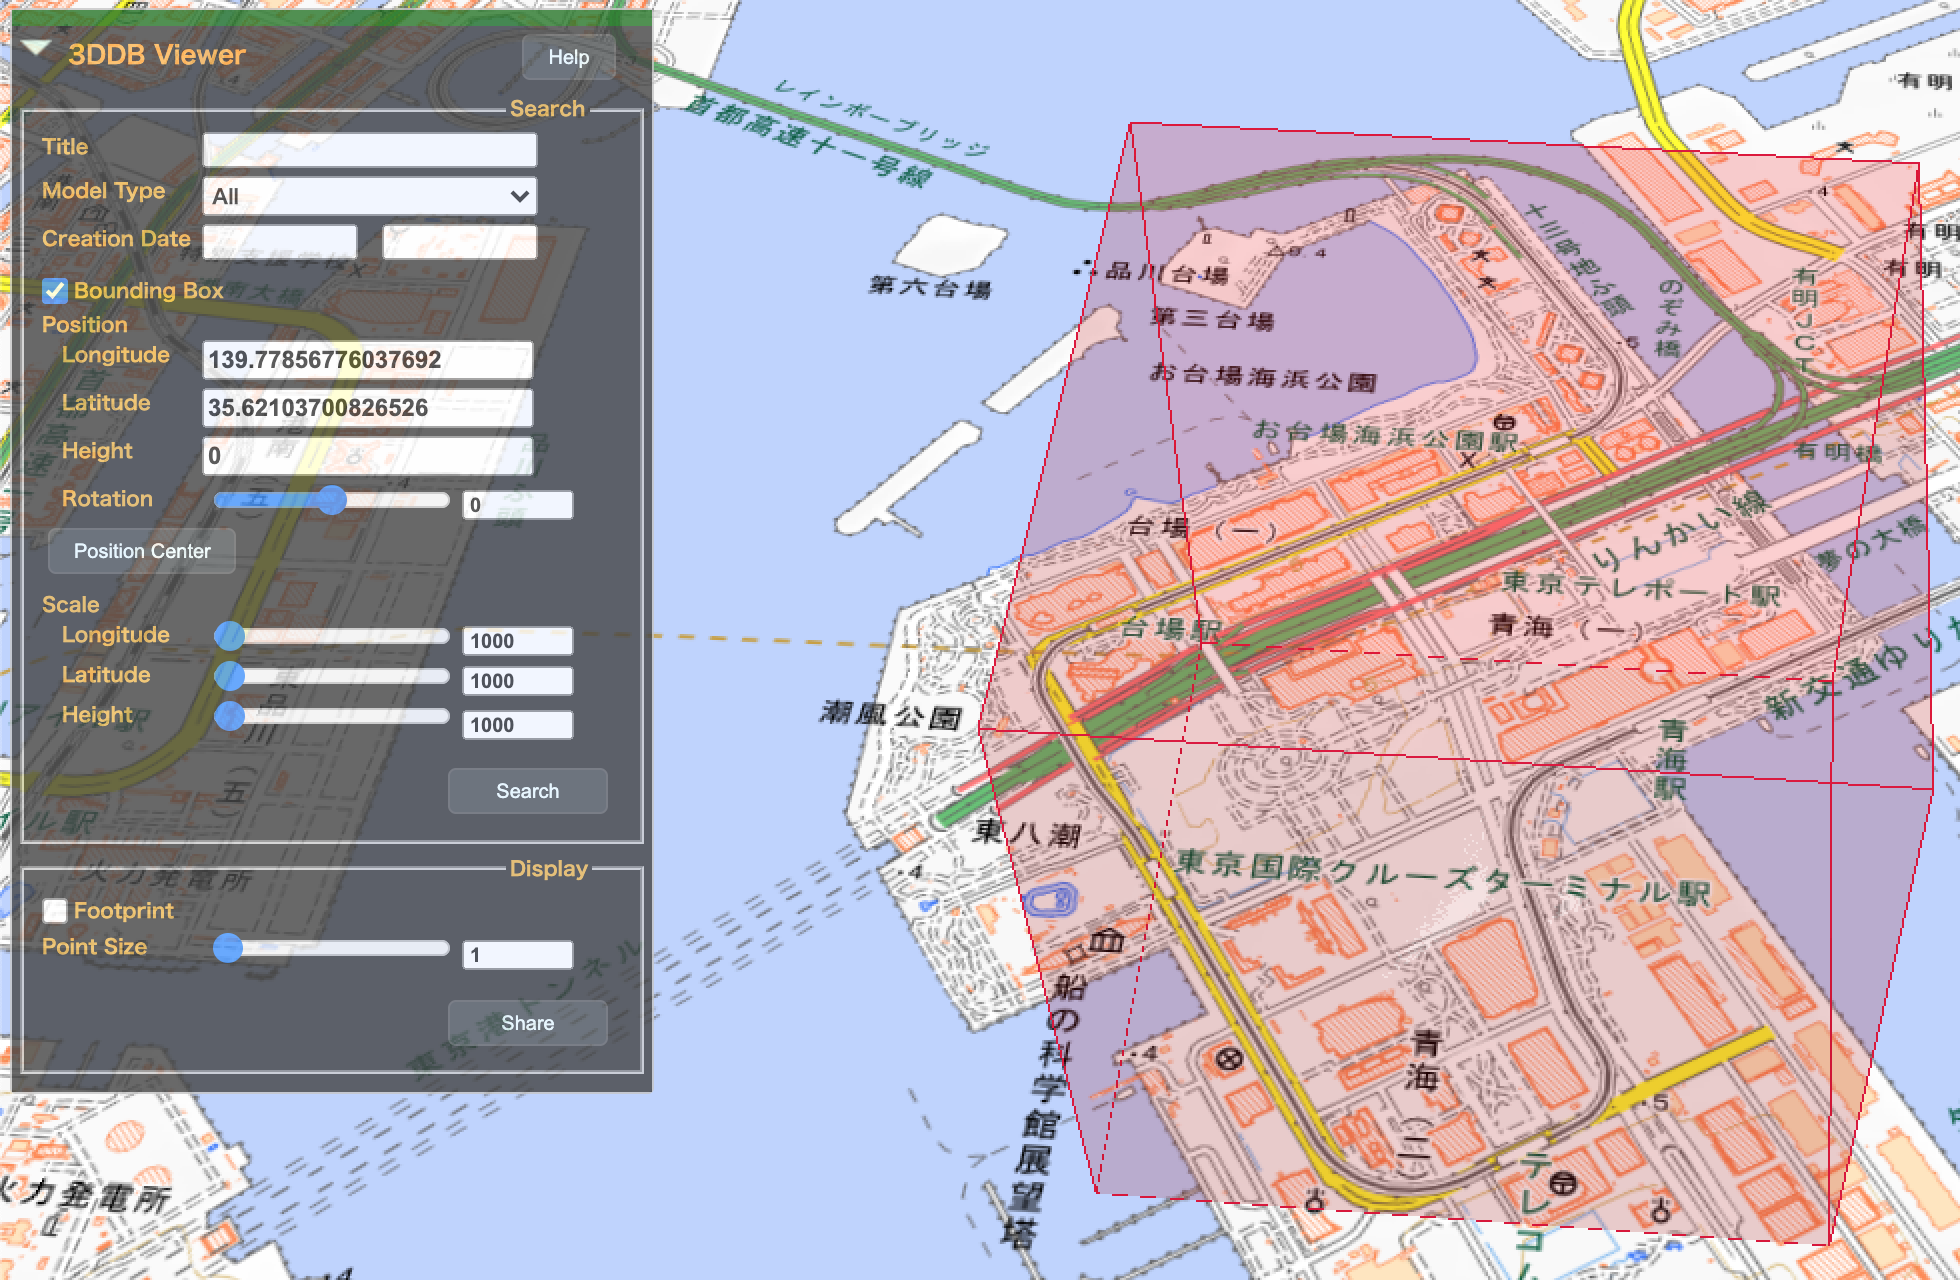
Figure 6. Bounding box
When the checkbox is unchecked, the item will return to its original state and the bounding box will disappear.
You can change the position and size of the bounding box from the items you have expanded as described above.
Each item is described below.
Position Item Name
Description
Longitude
Change the longitude [deg]
Latitude
Change the latitude [deg]
Height
Change the altitude [m]
Rotation
Rotate the bounding box around a vertical line [deg]
Position Center
Move the bounding box to the center of the base layer.
You can also change the latitude and longitude by dragging the bounding box on the base layer.
Scale Item Name
Description
longitude
Change the magnitude of the longitude [m]
latitude
Change the size of the latitude [m]
Height
Change the size of the height direction [m]
Model data add/remove to cart
When you execute a search with “Model Data Search”, the following dialog with search results is displayed.
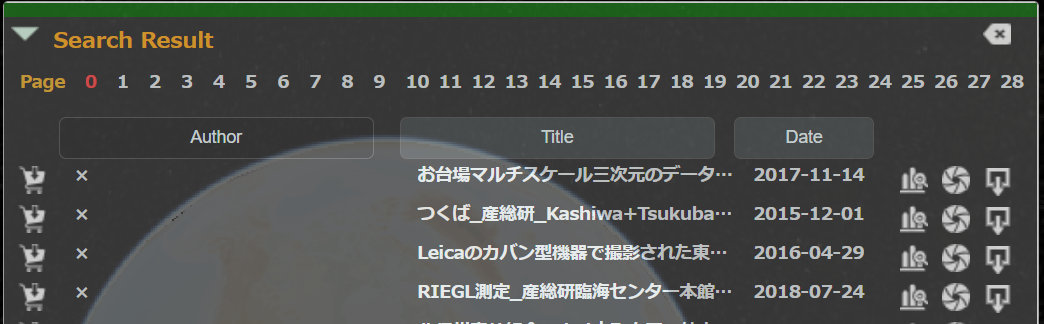
Figure 7. Search results available
Attention
If there are too many search results, slide the bottom slide bar.
If the result does not exist, a message is displayed stating that the result does not exist.

Figure 8. No results
It can be displayed etc by adding model data to the cart dialog.
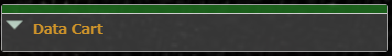
Figure 9. Cart dialog
The following is an explanation of how to add a cart and switch between pages of search results.
Figure 10. Add a cart Icon and switch between pages of search results (Click to enlarge)
Page switching in search results
Switch between pages of search results.
The number of data per page is 20, and the search results / 20 page numbers are displayed here. You can switch between the search results by clicking on the displayed page number.
Add to cart
Click to add model data to cart.
The following is an explanation of how to remove a cart.
Figure 11. Remove a cart Icon (Click to enlarge)
Remove to cart
Click to remove model data from cart.
Model data display and download
The following is an explanation of how the search results are displayed.
Figure 12. Search Results Icon (Click to enlarge)
Model data display ON/OFF
Switches the display of model data ON and OFF.
The state after the search (Figure 12) is the state of the display OFF.
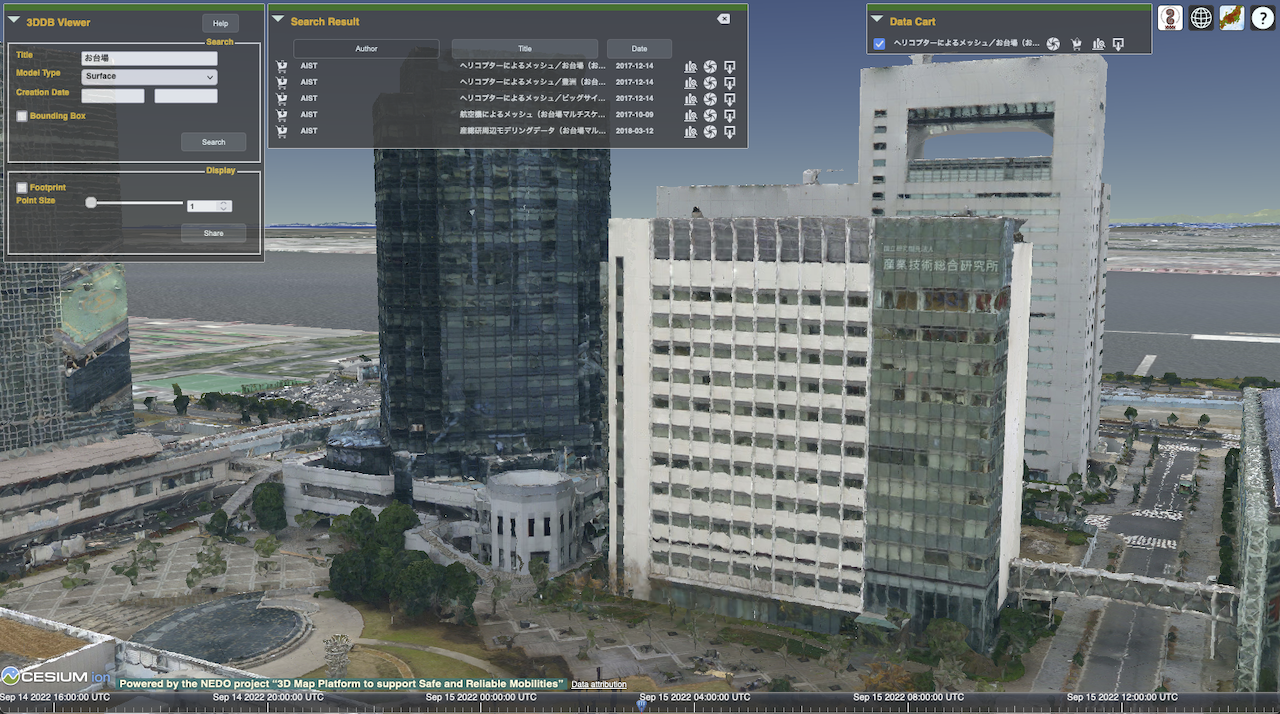
Figure 13. Example display of model data (Click to enlarge)
Moving to the location of the model data
Clicking on it will take you to the location of the model data.
Detailed model data information
Displays detailed information of model data.
When you click this button, the following dialog will be opened and detailed information will be displayed.
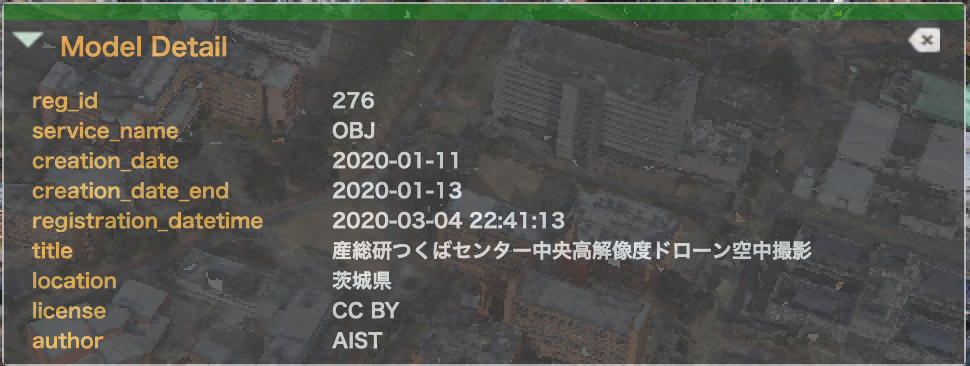
Figure 14. Detailed information
Download Model Data
Note
If the data is registered as non-downloadable when the model data is registered, the icon in question will be hidden.
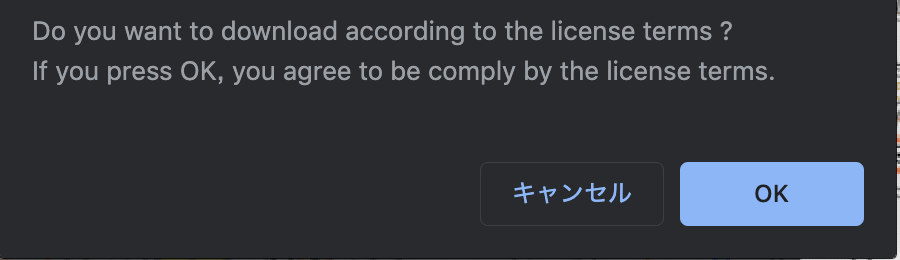
When you click this button, the following dialog will open and you can download the model data.
Figure 15. Download
Warning
When you download model data, you agree to abide by the license terms associated with that model data.
Control of display state
In order to display the model data, the following features are available that affect the overall display, not the individual model data.
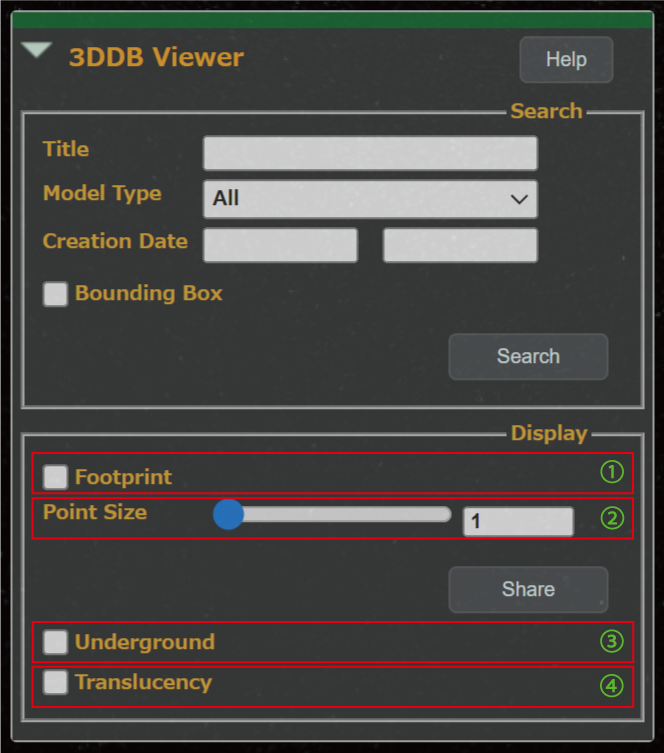
Figure 16. Display control (general)
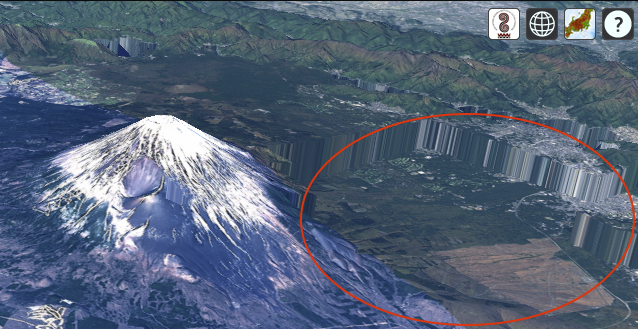
Foot print
Toggles the display of the wireframe area (foot print) drawn at the location where the model exists.
Initially, it is OFF.
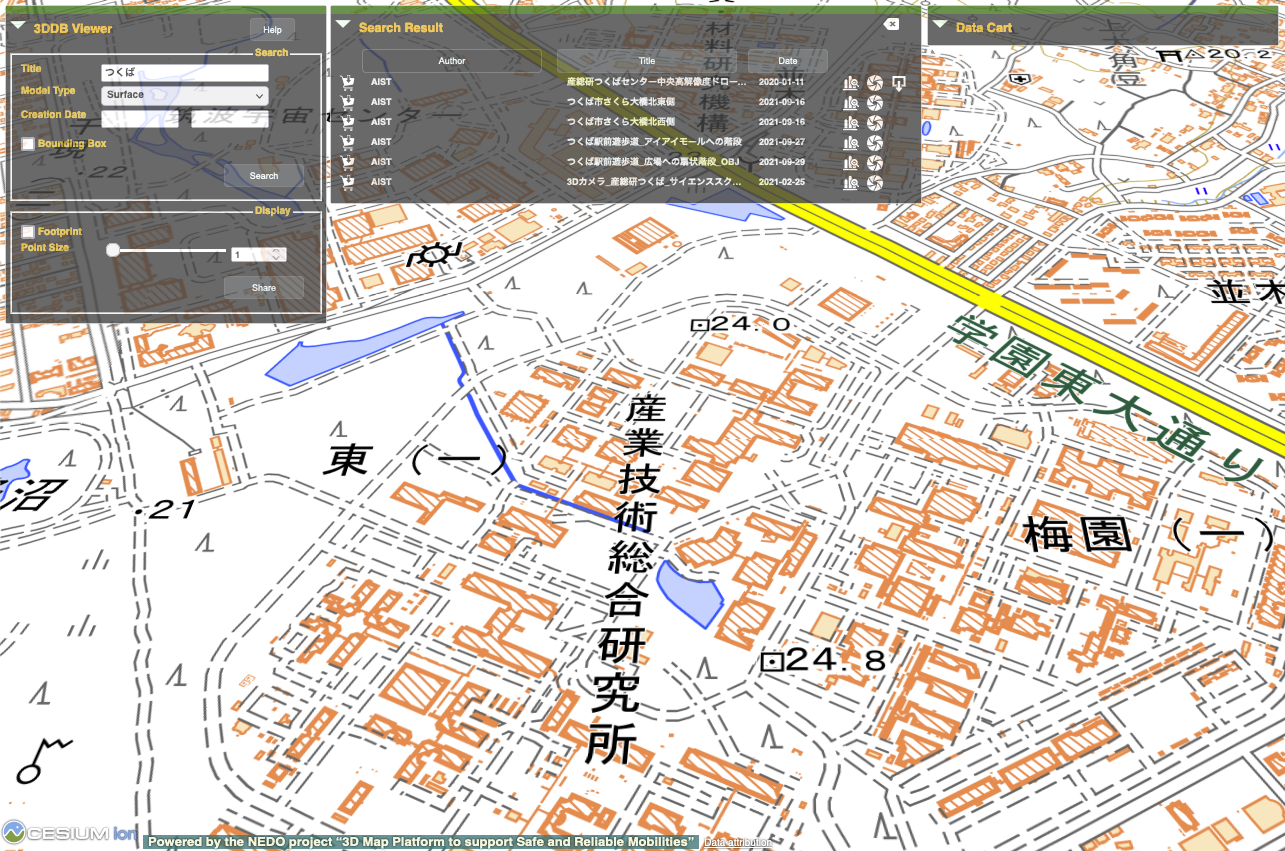
Figure 17. Foot print OFF
When this is turned on, foot print is drawn at the point where the model exists, as shown in Figure 18.
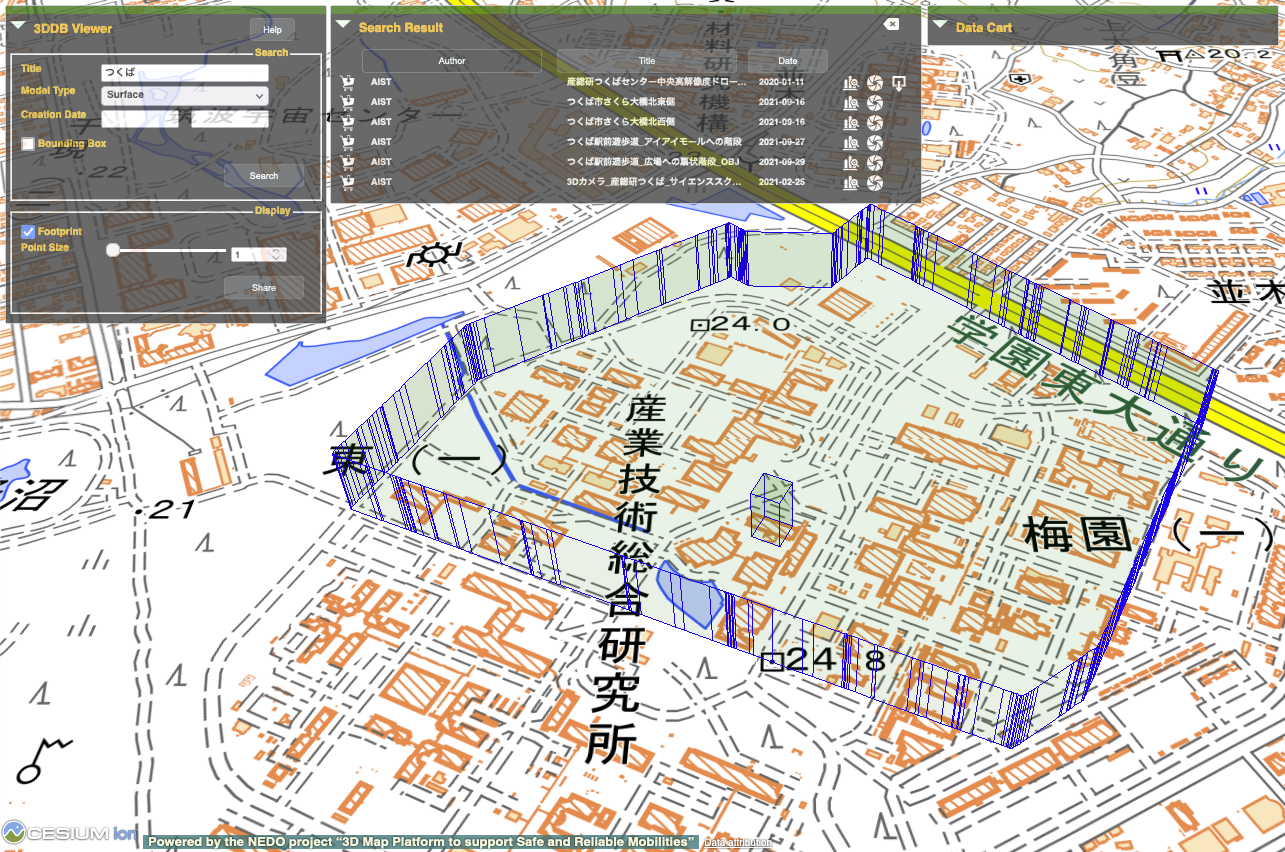
Figure 18. Foot print ON
When the model is displayed, the foot print of the model is automatically turned off.
Point Size
Changes the size of points in point cloud data. There is no effect on anything other than point cloud data.
Underground
Toggles of enable/disable the ability to move the viewpoint underground. Usable even when DEM displayed.
Translucency
Turns the ground transparency function ON/OFF. Usable even when DEM not displayed.
Share the display state
The 3DDB Viewer provides a function to generate a URL that allows you to recreate the display state of the model data. By sharing this URL, you can share the view of the model data.
Attention
This function works only the 3D view of scene mode.
If you use a URL generated in version 0.2 or earlier, you cannot restore the display state of model data.
This URL can be generated by clicking on the Share button in the Model Search and Display Control Panel.
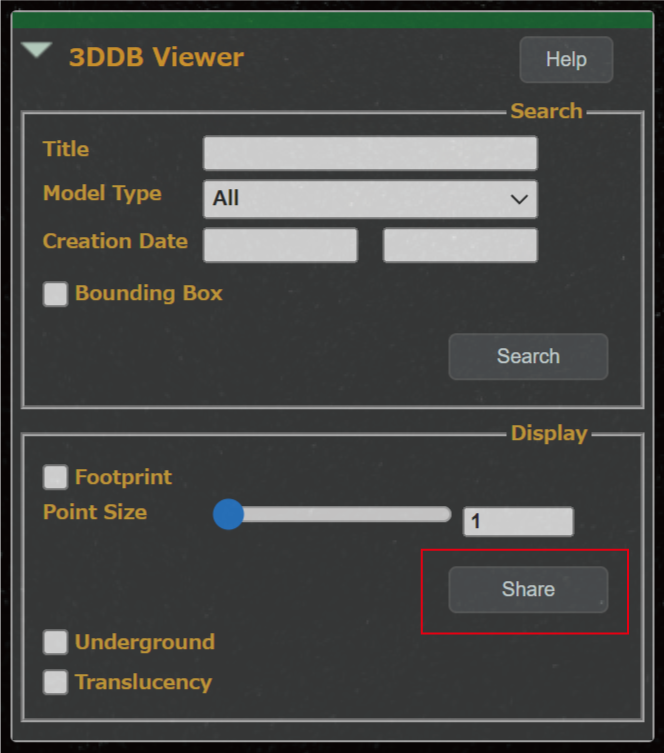
Figure 19. Share button
When you click the Share button, the following dialog will be displayed.
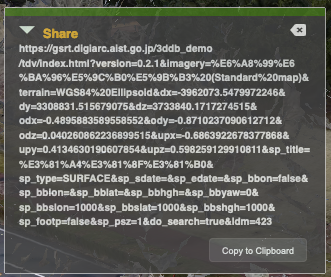
Figure 20. Share dialog
Clicking the “Copy to clipboard” button will copy the URL to the clipboard area. Use a text editor or other application to save the contents of the clipboard.
Toolbox
The toolbox is described below.

Figure 21. Toolbox
From left to right: Japanese cultural properties layer, Scene mode change, base layer switching, and simple help on how to operate.
Each of these features is described below.
Japanese cultural properties layer
The japan cultural properties layer displays the location of japanese cultural properties and information about each cultural property.
This layer is realized using data provided by the National Institutes for Cultural Heritage, Nara National Research Institute for Cultural Properties as part of a joint research project between the National Institutes for Cultural Heritage, Nara National Research Institute for Cultural Properties and the National Research and Development Agency, National Institute of Advanced Industrial Science and Technology (AIST) .
Icon to expand the dialog shown in Figure 22.
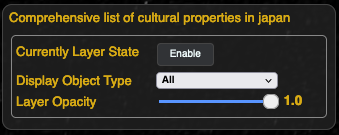
Figure 22. Layer control dialog
A description of each item is provided below.
Item Name |
Description |
|---|---|
Currently Layer State |
The current state of the layers.
Clicking the button toggles between enabling and disabling the layer.
|
Display Object Type |
Select the format for displaying the location of cultural properties.
Polygon: Displays the location of the cultural property as an area (polygon).
Point: Displays the location of the cultural property as a point.
All: Displays a mixture of polygons and points.
Since the number of data is larger for points, we recommend the use of points
for comprehensive browsing.
|
Layer Opacity |
Changes the transparency of the layer.
You can specify transparency from 0.0 to 1.0 (in step of 0.1).
1.0 is opaque and 0.0 is fully transparent.
|
When the layer is activated, the location of the cultural property is displayed as shown below.
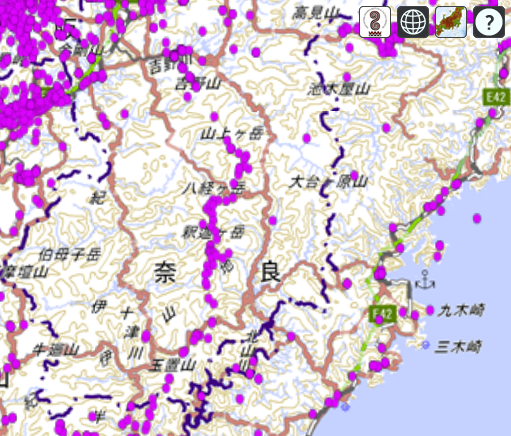
Figure 23. Example of layer display
By clicking on a polygon or point, information about the cultural property can be displayed.
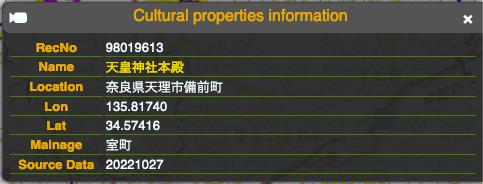
Figure 24. Information of cultural properties
A description of each item is provided below.
Item Name |
Description |
|---|---|
RecNo |
The RecNo is ID on ‘Comprehensive list of cultural properties WebGIS’ system operated
by the Nara National Research Institute for Cultural Properties.
IDs with only numbers mean data for ‘various cultural properties and ruins DB
(Nara National Research Institute for Cultural Properties)’ and IDs starting with ‘S’ mean
data for ‘abstracts of archaeological sites’.
|
Name |
Name of cultural property.
Click to open the ‘Comprehensive list of cultural properties WebGIS’ system.
|
Location |
Location information. |
Lon |
Longitude information. |
Lat |
Latitude information. |
Mainage |
Information on the main age of cultural properties. |
Source Data |
Date data provided. |
Scene mode change
After clicking on the icon, the icon will expand as shown in Figure 25, and you can select the desired mode.

Figure 25. Scene mode change
The icons for each mode are, from the top, 3D view, 2D view and 2.5D view (Columnbus View).
The order of display changes depending on the selected mode, so try to remember the icon and mode, not the order of display.
Base layer switching
Click the icon to expand the dialog shown in Figure 26. Select the desired base layer image and Digital Elevation Model (DEM).

Figure 26. Base layer switching
You can select one image from Imagery for base layer and one from Terrain for DEM.
When launching the 3DDB Viewer, “標準地図 (Standard map)” for Imagery and “WGS84 Elipsoid” for Terrain are specified.
The following Imagery/Terrain are not part of the CesiumJS standard, but were prepared for 3DDB Viewer.
Imagery
“地理院タイル “ published by the Geospatial Information Authority of Japan (GSI) are available for selection.
標準地図 (Standard map)
淡色地図 (Pale map)
写真 (Seamless photo map)
陰影起伏図 (全球版)
Note
In both cases, the accuracy of data outside the Japanese region is quite low.
Terrain
DEMs generated based on fundamental map information can be selected with permission (“測量法に基づく国土地理院長承認(使用)R 5JHs 111」”) from the Geospatial Information Authority of Japan (GSI) .
地形図の等高線 (10m メッシュ)
航空レーザ測量 (5m メッシュ)
写真測量 (都市周辺等 5m メッシュ)
写真測量 (一部の島嶼部等 5m メッシュ)
Note
In both cases, data is provided only for the Japan region.
Seamless elevation tile published by the Integrated Geo-information Research Group, Geological Survey of Japan Research Institute of Geology and Geoinformation, National Institute of Advanced Industrial Science and Technology (AIST) are available for selection.
陸域統合 DEM
A global terrestrial DEM synthesized from multiple data sources. For information on the data sources used in each country/region, please click here .
Attention
Only the Japan area is in ellipsoid height, while the other areas are in elevation.
Attention
It is not recommended to enable DEM “Cesium World Terrain” or “地形図の標高線” or “航空レーザー測量” on older hardware with built-in GPU on CPU, as enabling them will increase the load.
The “航空レーザー測量” or “写真測量” 5m mesh may not be displayed correctly because some areas are not covered.
Please check the GSI’s following page to see what areas are not covered.
Simple help on how to use
When you click the icon, the dialog shown in Figure 27 will be expanded to display a simple explanatory diagram of the operation on the base layer.
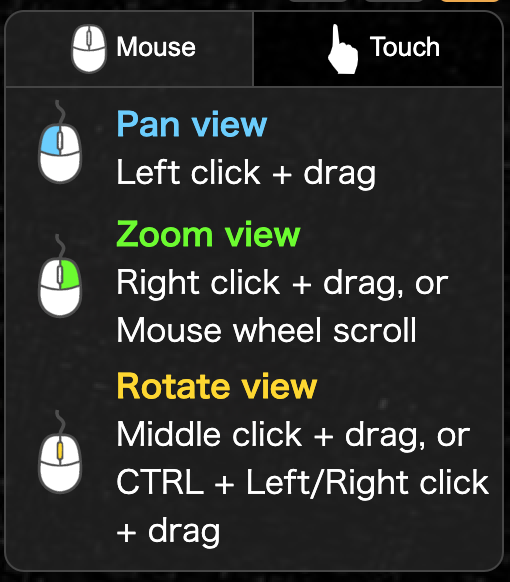
Figure 27. Simple help
When you click on a different location after viewing, the dialog is automatically hidden.
Other
Dialog common operations
The common operations of the dialog are described below.
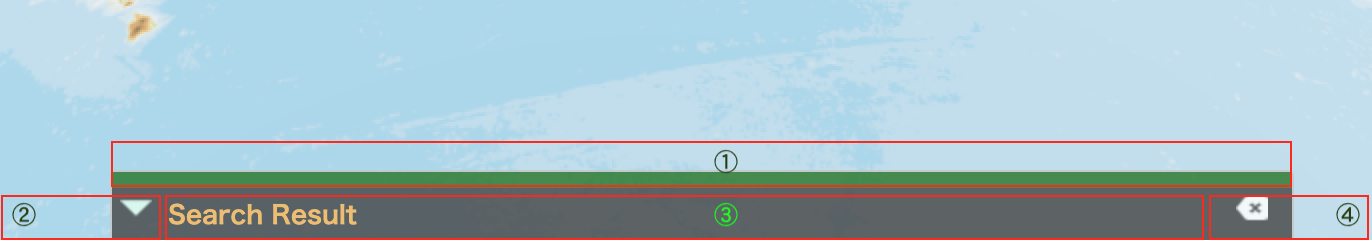
Figure 28. Dialog common operations
(1). Moving bar
You can move the position of the dialog.
By dragging the bar, you can move it to the desired location.
(2). Collapse button
Click to collapse the dialog.
Click again to un-collapse the dialog.
(3). Label
Labeling to identify the dialog.
It cannot be manipulated.
(4). Close button
Click to close the dialog.
Some dialogs do not have a close button.
Show help
You can refer to this manual by clicking on the Help button.
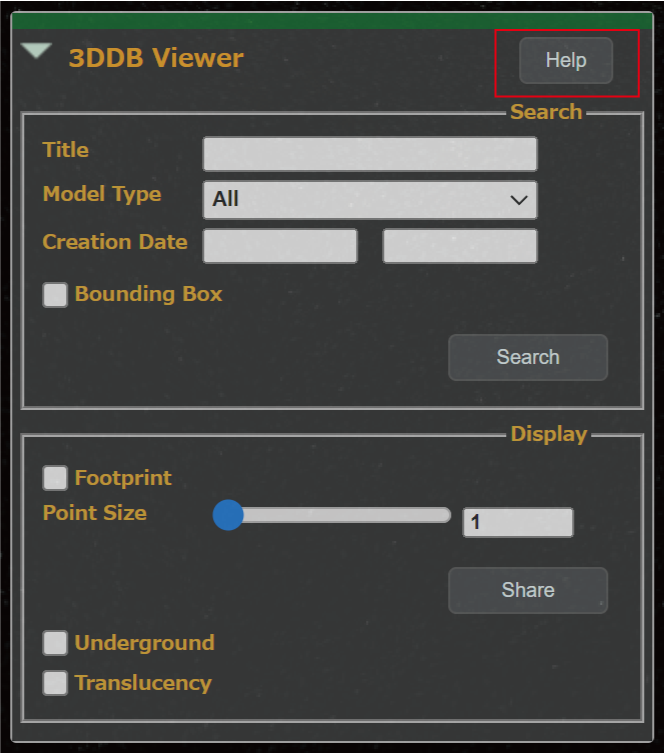
Figure 29. Help button